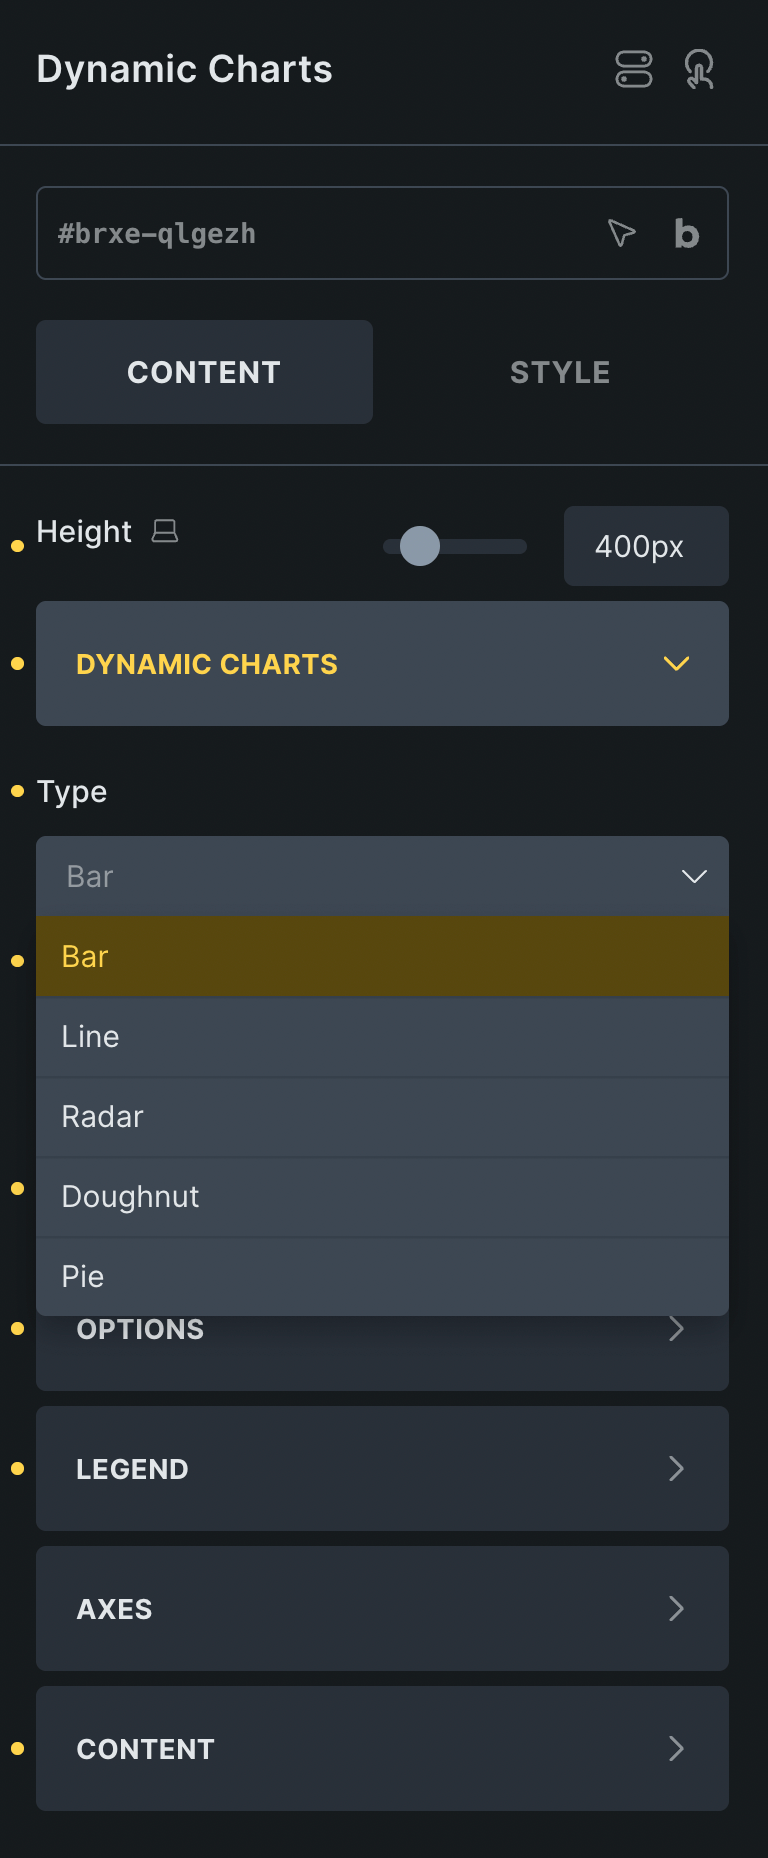
Dynamic Charts lets you visually represent data inside Bricks using interactive and fully customizable chart types including bar, line, radar, pie, and doughnut. Choose between a simple inline input or load CSV data from a URL or textarea. Configure how the data is parsed, styled, and displayed, with control over axis labels, legends, titles, step sizes, and value formatting. Perfect for turning raw data into compelling, on-brand visual insights.